Exploratory Data Analysis - Part one
A self-motivated effort to analyze, predict and understand H1B approval/denials over the years.
Exploratory Data Analysis - H1B
Overview
This repository provides an exploratory data analysis (EDA) of H1B visa application trends using publicly available data from USCIS. The project includes data collection, processing, visualization, and the development of a centralized dashboard hosted on AWS.
Data Source
H1-B Employer Data Hub https://www.uscis.gov/tools/reports-and-studies/h-1b-employer-data-hub
Features
- One-time collection of public H1B visa data from USCIS.
- Data cleaning and transformation.
- Analysis of approval vs. denial rates by employer, industry, and state.
- Visualization of key metrics and trends.
- AWS integration using S3, Glue, Athena, and Lambda for automation.
- Interactive dashboard deployment using Streamlit/Flask.
Repository Structure
Exploratory-Data-Analysis-H1B/
│── data/
│   ├── raw/                  # Raw H1B dataset
│   ├── processed/             # Cleaned and transformed data
│── notebooks/
│   ├── 01_data_cleaning.ipynb # Data preprocessing and wrangling
│   ├── 02_EDA_visualization.ipynb # Exploratory analysis & visualizations
│── scripts/
│   ├── fetch_data.py          # Script to fetch USCIS data
│   ├── process_data.py        # Data transformation and feature engineering
│   ├── dashboard.py           # Streamlit-based visualization dashboard
│── aws/
│   ├── lambda_functions/      # AWS Lambda scripts
│   ├── s3_bucket_config/      # S3 storage setup
│   ├── glue_jobs/             # AWS Glue ETL scripts
│   ├── athena_queries/        # AWS Athena SQL queries
│── requirements.txt           # Dependencies
│── README.md                  # Project overview
│── dashboard/                 # Web-based UI
│── config.yaml                # AWS configurations
│── Dockerfile                 # Containerization
│── .gitignore                 # Ignore unnecessary files
Installation
- Clone the repository:
git clone https://github.com/nagakirankasi/Exploratory-Data-Analysis-H1B.git cd Exploratory-Data-Analysis-H1B - Install dependencies:
pip install -r requirements.txt
Usage
1. Fetch Data
Run the script to download H1B data:
python scripts/fetch_data.py
2. Process Data
Clean and transform the dataset:
python scripts/process_data.py
3. Run Exploratory Analysis
Use Jupyter notebooks for visualizations:
jupyter notebook notebooks/02_EDA_visualization.ipynb
4. Launch Dashboard
Start the Streamlit dashboard:
streamlit run scripts/dashboard.py
AWS Integration
- S3 Storage - Store processed datasets in AWS S3.
- Glue ETL - Automate data transformation.
- Athena Queries - Run SQL queries on S3 data.
- Lambda & API Gateway - Deploy the dashboard as a serverless app.
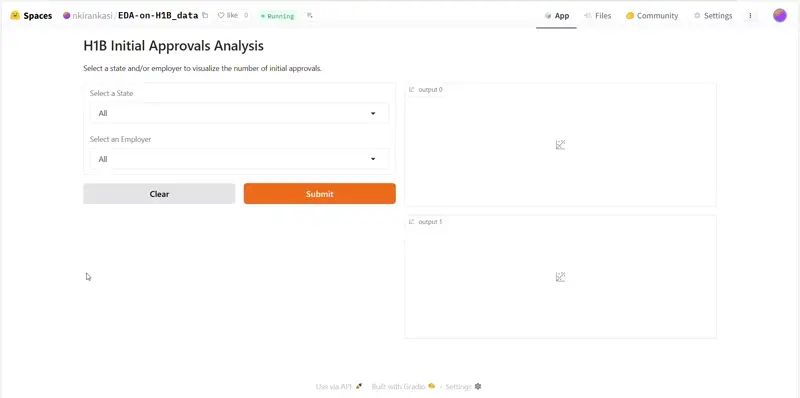
Demo
- Used huggingface + gradio to test out the look
Contributing
Feel free to fork the repository, create a feature branch, and submit a pull request.
License
This project is licensed under the MIT License.